Designing for designers.
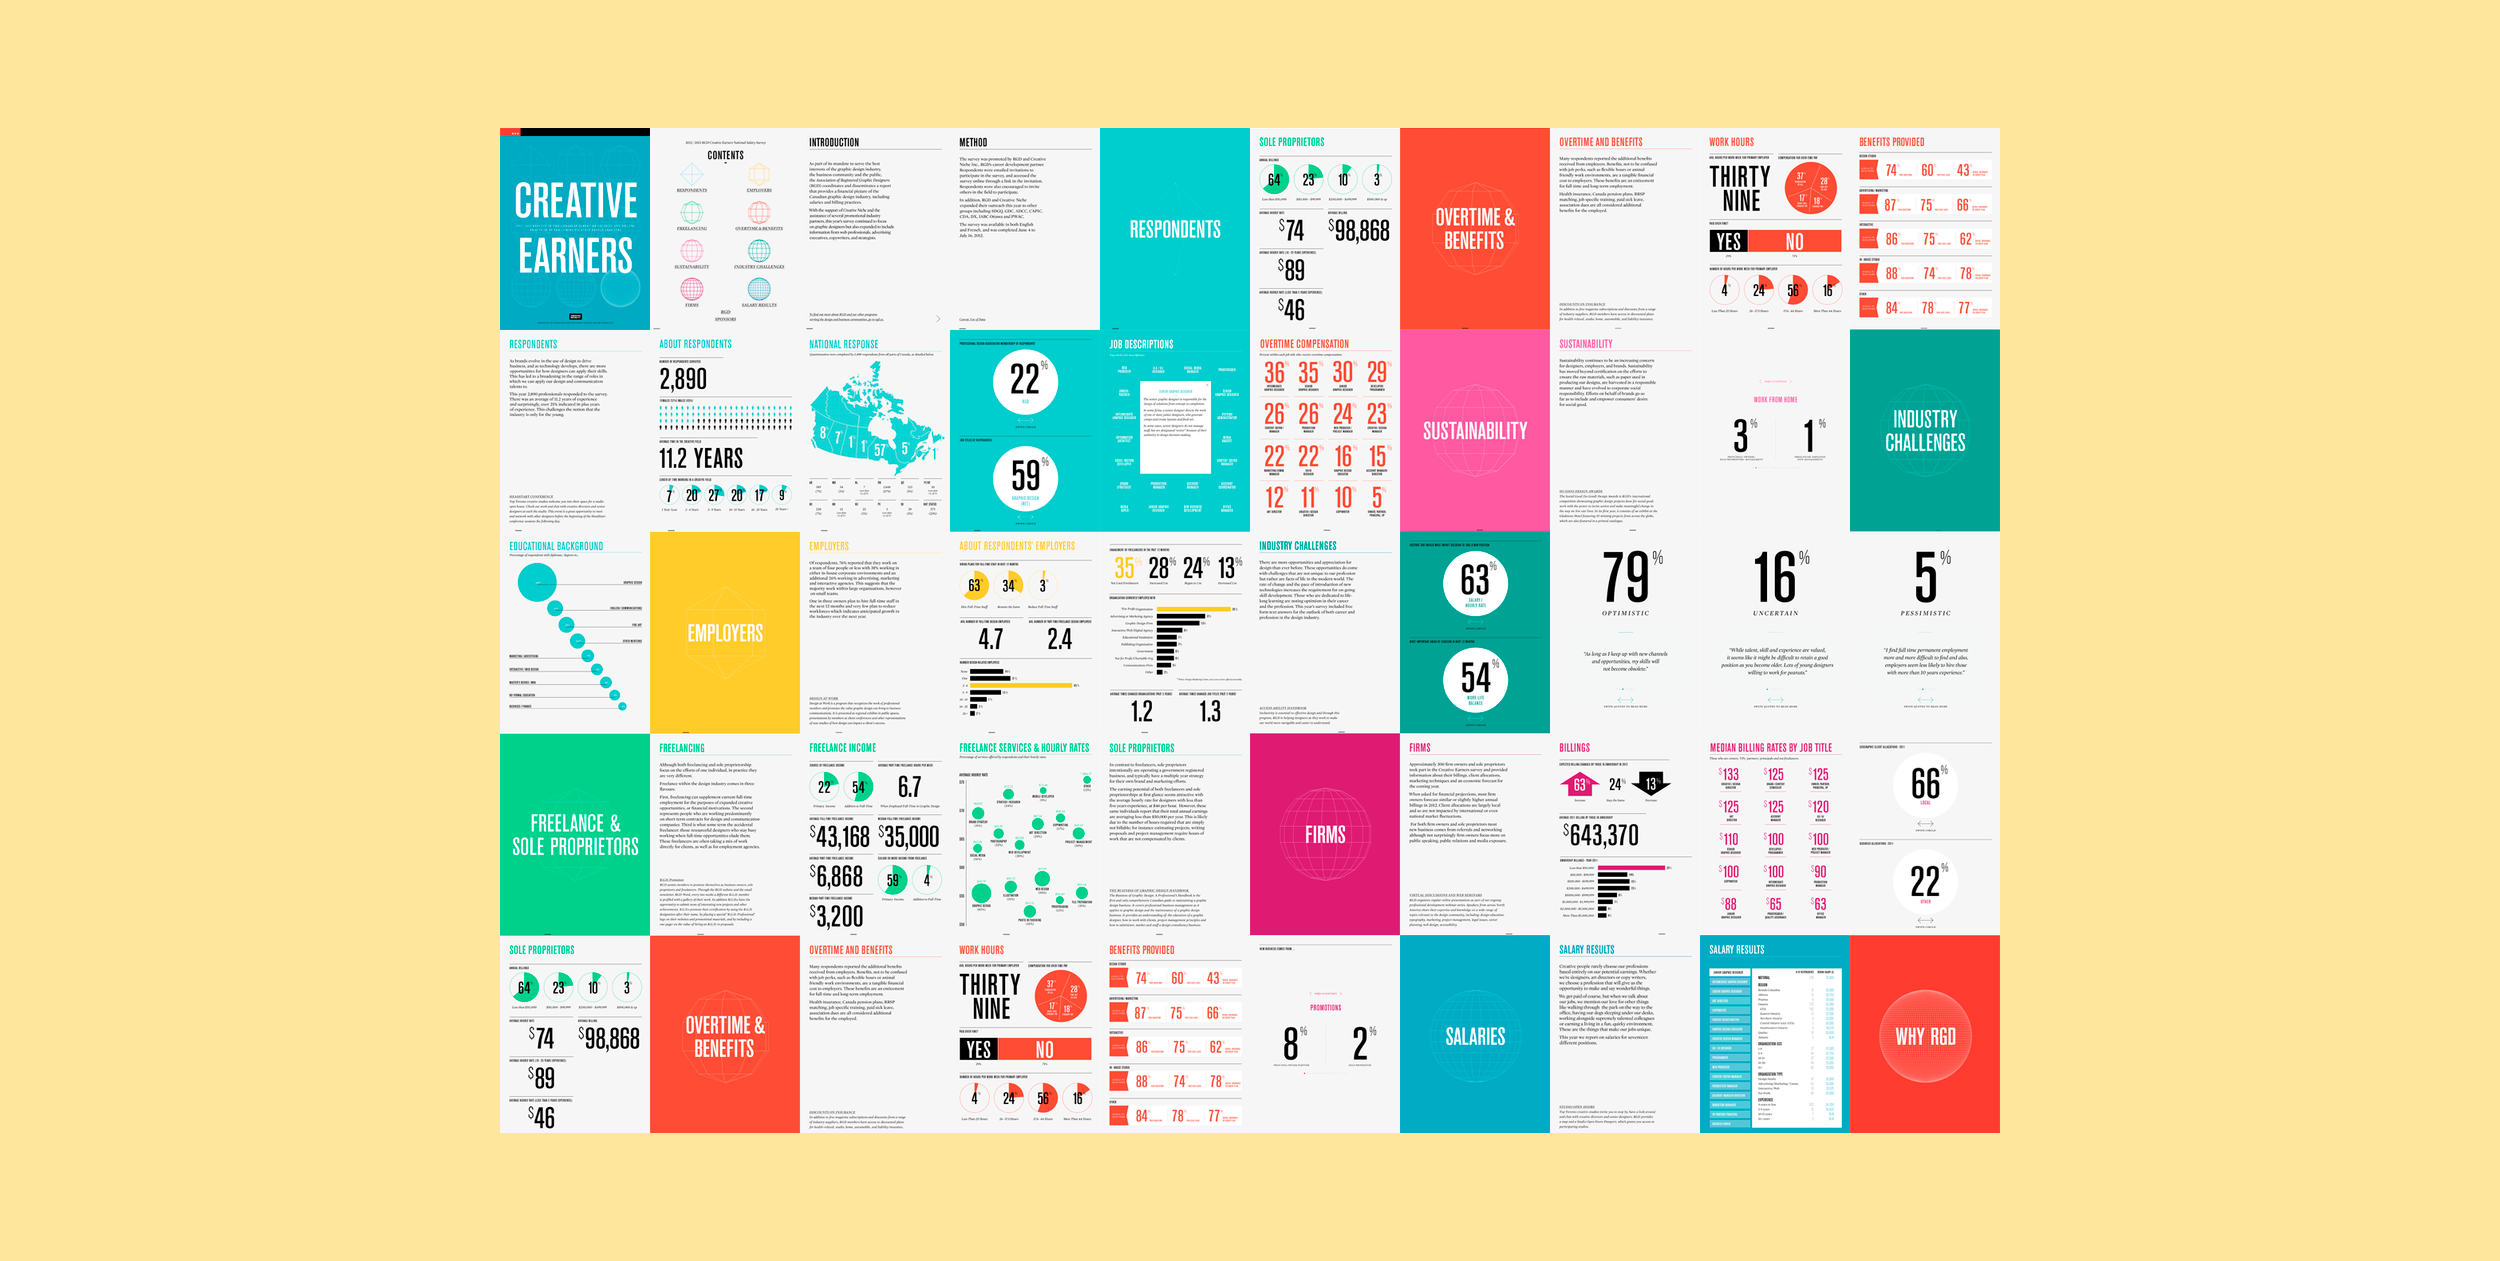
The Association of Registered Graphic Designers annually invites graphic design professionals from across Canada to complete a confidential online survey to provide information about their salary and billing practices in the industry. We created an interactive digital report that brought the results of the survey to life with bold and colorful infographics. It was available as both a download on the iTunes App Store as well as an old-school PDF.
RGD Salary Survey

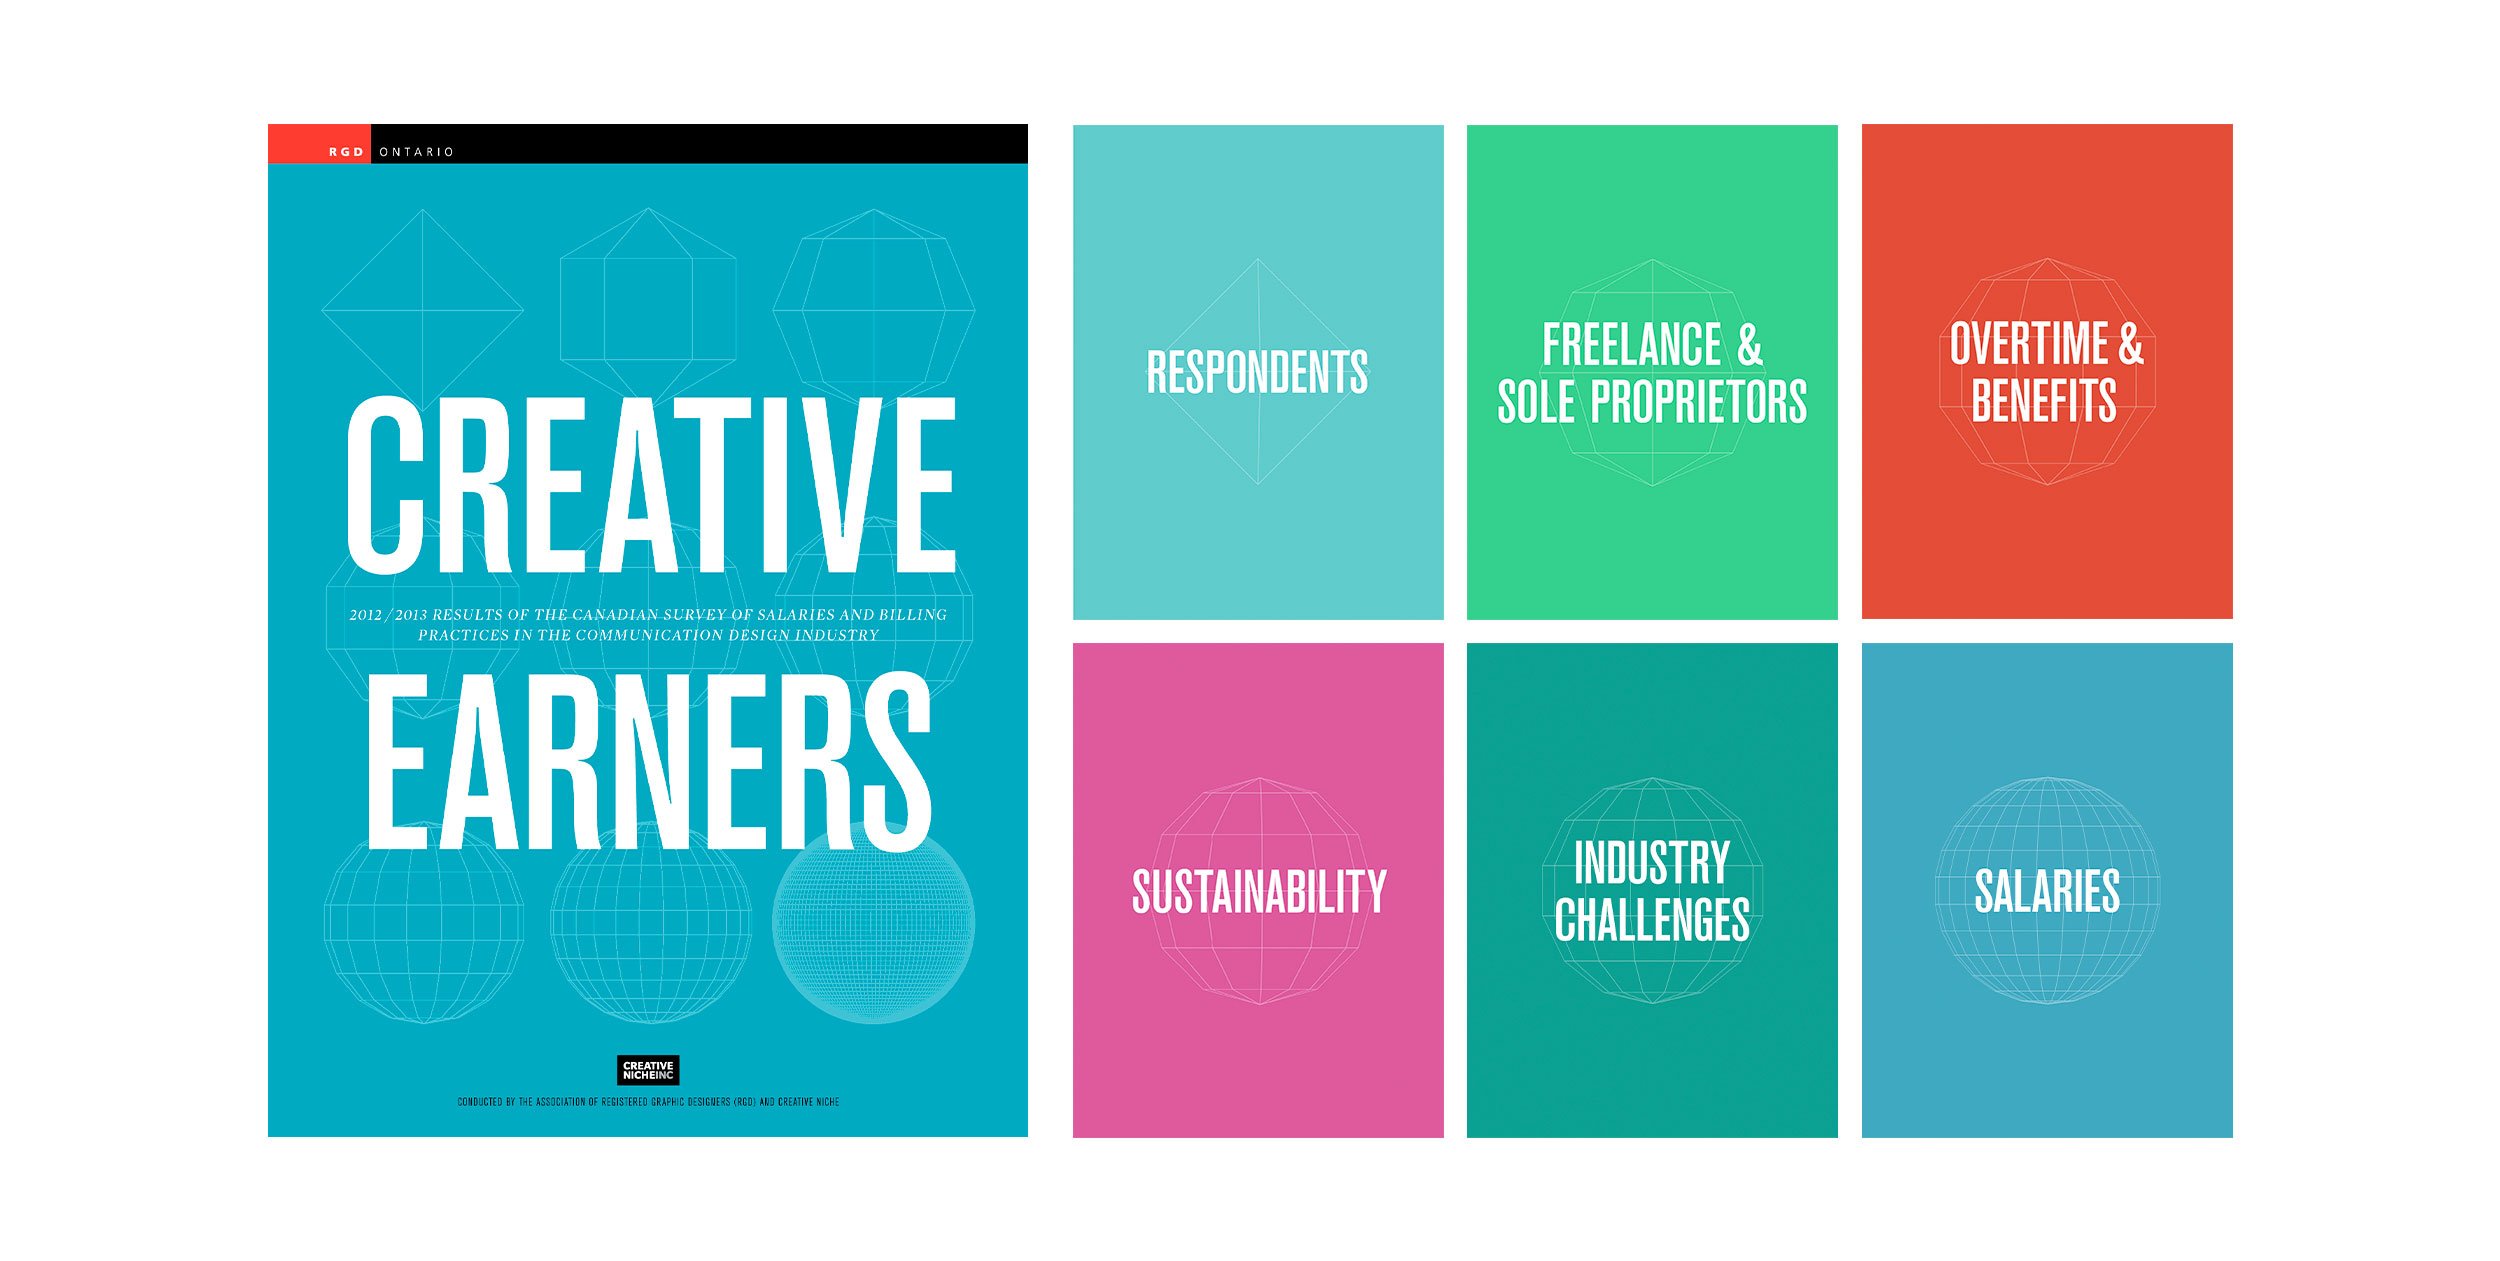
Contrast & color.
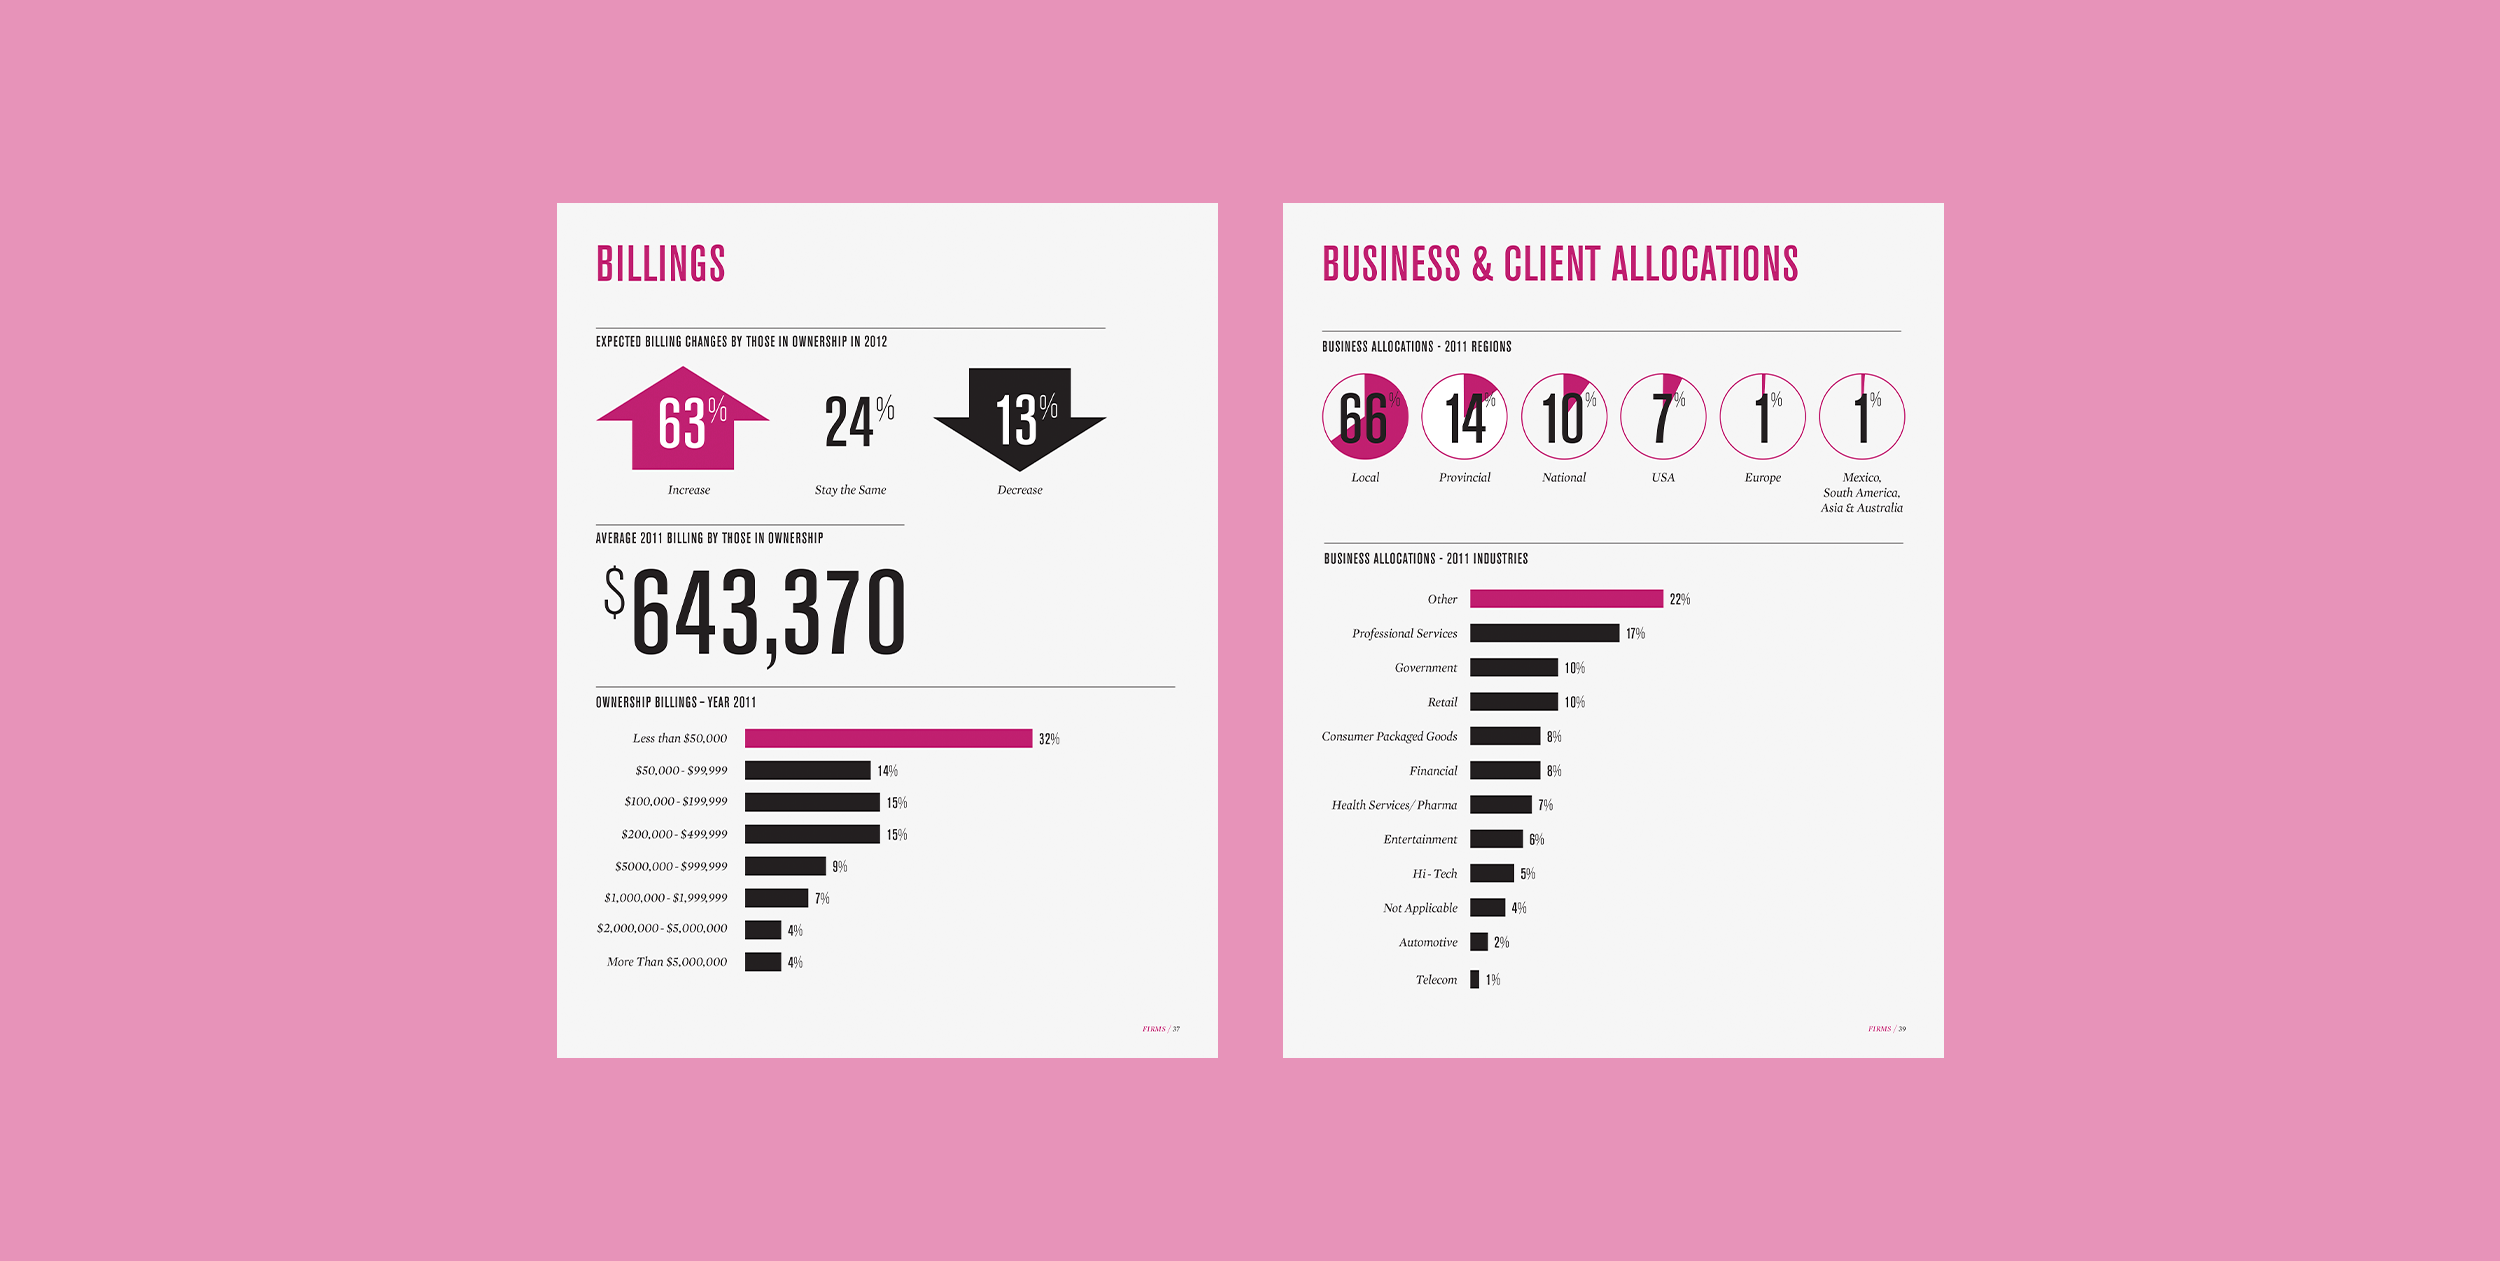
With such a discerning audience we knew we would have to make our data clearly informative while also visually appealing. We looked to contrast of size, bright colors and various formats to draw our readers in.


A (r)evolving narrative.
In addition to color coding the sections I created a simple 3d graphic that gradually became more complex as the report progress. It was animated to revolve with the user’s touch on iPad.

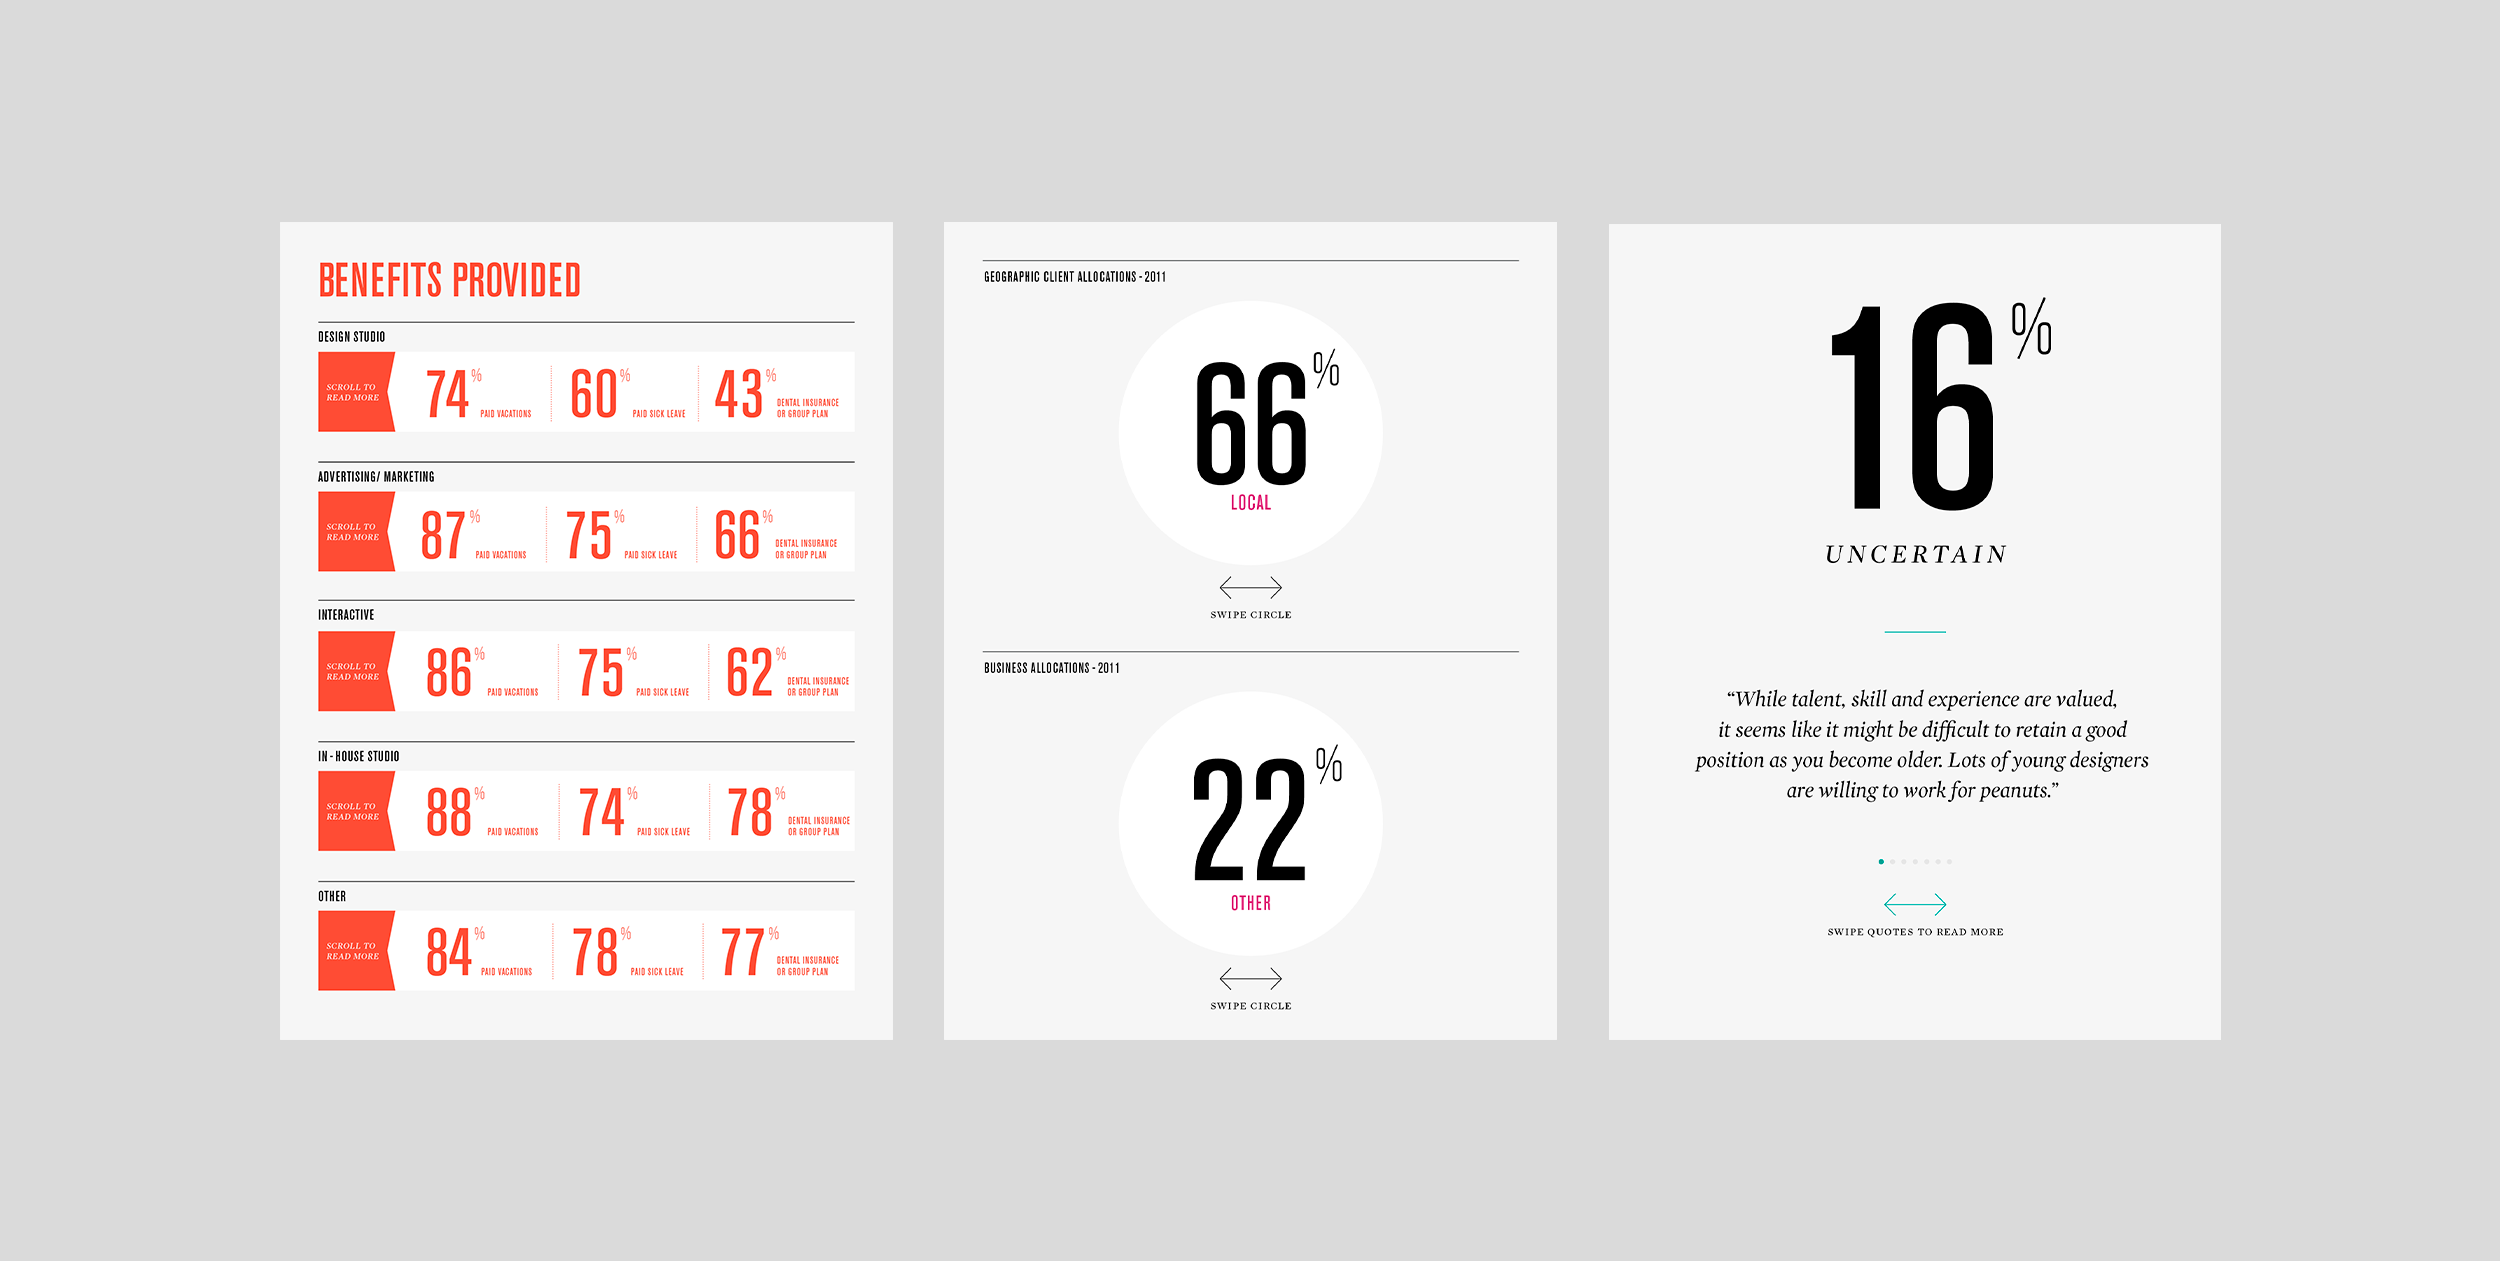
Interactive infographics
This annual report was completely designed for an interactive app experience. Rather than layout all figures and stats as in years past, we were able to utilize Adobes Digital Publishing Suite's features to create an an interactive experience with gestures such as scrolling, swiping, and taping to reveal discoverable content.

